07 March 2015

The search for the unknown

The search for the unknown

The search for the unknown, 
Has baffled one and all.
The path of science has been reason,
The faithful invoking spiritual call.

Some look hither and thither,
To fathom a piece of that infinity.
Making sense of that unending wonder,
That leads them to that singularity.

Others dwell deep within,
Meeting thyself becomes profound.
Unravelling from that bottomless bin,
An act where prose and poetry abound.

One knows not from where,
That intuition comes to facilitate reason.
Or, how logic seems to be there,
To justify the act of a spiritual person.

The mere mortal is confused,
Thy understanding needs review.
So that knowledge is not misused,
And, search for the unknown continue(s).


(The motivation for this comes from many things, but I would like to highlight three of them. The first being my reading of "The Man Who Knew Infinity: A Life of the Genius Ramanujan" by Robert Kanigel, which is a gift sent by a mentee-cum-colleague, Durgesh Pathak. I immensely enjoyed reading the book and it was a pleasant surprise. The second is a poem I read in a closed facebook group "Adda e-cafe". The poem was written by Vinita Agrawal where the last line read "how much of me I still need to meet." The third is the increasing incidences of misuses or abuses of both science and religion.)

10 February 2015

Jhadoo sweeps Delhi, expectations galore

The results of the Delhi 2015 elections shows a landslide for the Aam Aadmi Party (AAP). Congratulations to the common man! Congratulations to Arvind Kejriwal!

In a two-sided contest AAP has got 67 of the 70 seats and 54 per cent of the popular vote share. The Bharatiya Janata Party (BJP) has got 3 seats and 33 per cent of the vote share while the Indian National Congress  (hereafter, Congress) has won no seats and got about 10 per cent of the vote share.

Compared to the general election in May 2014, this situation has reversed because at that time AAP led in only 10 of the assembly segments and got 33 per cent of the vote share. BJP had then got 46 per cent of the vote share and led in 60 segments. The Congress like now had not led in any of the assembly segments but had received a 15 per cent vote share.

In December 2013 state elections, AAP had got 28 seats and 29 per cent of the vote share. The BJP and its ally had got 32 seats at 34 per cent of the vote share while the Congress had got 8 seats and 25 per cent of the vote share.


It needs to be mentioned that in the 2008 state elections AAP did not exist. At that time the BJP and its ally had won 23 seats and got 37 per cent of the vote share while the Congress had won 43 seats with 40 per cent of vote share.

One can state the following.
  • In December 2013, compared to 2008, the vote share that AAP got is a shift from other parties: Congress (15 percentage points) BJP (4 percentage points) and others (10 percentage points).
  • In May 2014, compared to December 2013, AAP increased its vote share by a further 4 percentage points while BJP increased its vote share by 12 percentage points. During this period, Congress lost another 10 percentage points in its vote share. This means that nearly 6 percentage points of the overall gain in vote share by AAP and BJP would be attributed a net shift from others.
  • In February 2015, compared to May 2014, AAP increased its vote share by 21 percentage points, BJP decreased its vote share by 13 percentage points, and Congress decreased its vote share by an additional 5 percentage points. In short, AAP gained from BJP, Congress as also others.
  • In February 2015, BJP's (including its ally) vote share is only one percentage points lower than what it had got in December 2013. In some sense, its core voter base seems to be intact.
  • The net gain that the BJP had during the general elections of May 2014 is lost. A large section of voters that swung from the Congress and others to the BJP in May 2014 seems to have now posed their faith in AAP in February 2014.
Now, a question to ask is who are the core voters of BJP. Are they the ones who like BJP's socio-cultural thinking. Or, are they the ones favouring their economic thinking. It is difficult to make such neat bifurcations. But, it is possible that the shift is from among those who may support their economic policies, but are not happy with their socio-cultural thinking.

While this being a state election, one need not use it as a reflection on the public mood on the policies by the central government. Nor is it a referendum again Prime Minister Narendra Modi. But, then the BJP has to rethink about its policies and bring about a balancing act that should satisfy both the set of core supporters.

Having said that, should BJP (particularly, the central government) not be concerned about those who did not vote for it to begin with. Or, those that have sided with AAP to begin with. What is it that they want. Not, in terms of politics, but in terms of their economic thinking and what do they mean by development.


AAP is outside the left versus right ideological divide, but if it has to succeed it has to be pro people. It is here that the challenge lies in an alternative articulation of an economic thinking that enhances the livelihood of all. It also needs an articulation of what is the constitutive component of development. It is not about facilitating big ticket growth with the 'hope' that it would some day trickle down. But, it is rather about an enabling environment where the common man contributes to this growth. 

The expectations from AAP are many. While in terms of policies and their implementation this need not be to the left, but it certainly is not necessarily towards the right. The challenge for AAP is to maintain this middle ground. Otherwise, the jhadoo that has swept it into "5 saal kejriwal" will sweep it away from the common man.

07 February 2015

Delhi Votes 2015

Today (7 February 2015), Delhi is voting again. In December 2013, the 15-year rule of the Congress came to an end with BJP (Bharatiya Janata Party) and its allies getting the maximum number of seats (32/70), but fell short of a majority. A minority government by AAP (the newly constituted Aam Aadmi Party) with 28 seats formed a government, but gave up this responsibility in 49 days; it has been nearly an year since then. 


In the interim, the Lok Sabha elections in May 2014 gave a resounding victory to BJP that gave India its 15th Prime Minister, Narendra Modi. And, in Delhi the BJP won in all the seven parliamentary constituencies and were leading in 60 of the assembly segments. Thus, immediately after that the writing on the wall was that BJP would have a convincing majority in the next assembly elections when it would be held.

Recent pre-poll surveys have shown that the competition is likely to be close finish between AAP (with Arvind Kejriwal as its Chief Ministerial candidate) and BJP (with Kiran Bedi as its Chief Ministerial candidate) and many of them giving AAP an edge. After an experience in the previous two elections, AAP was better prepared and did not allow the debate to be set in terms of how BJP wanted it to be. For instance, it did not engage with the BJP's five questions per day. It was also able to counter and defend some (rather most) of the allegations. There were some internal differences within AAP and a lesson that they have learnt from previous elections is that while respecting internal democracy they do not want to go into the details when elections are ongoing.

In any case, there has been a surge in AAP and its Chief Ministerial candidate's popularity (I have heard some BJP sympathizers also arguing in their favour). However, with my two pence of understanding, I somehow had a feeling that the day before elections (when there would be no official campaigning) would matter. In this sense, Imam Bukhari's statement in favour of AAP (it is immaterial whether this was a personal statement or because of some backdoor parleys) came to BJP's advantage even while AAP was quick to deny that support. The BJP volunteers, while not officially campaigning, would have made all efforts to convey their side of the story in their voter-level micro-management.

The aggressive position of BJP that AAP is appeasing minorities could veer some voters if the atmosphere gets charged and also get their sympathizer's back to their fold. With the experience of two recent elections, AAP would have been aware of keeping their volunteers in preparation for this last minute need. Today's election would also depend on how they would have countered on this as also other aspects of BJP's last minute micro-management.

I also have a feeling that the Congress (with Ajay Maken as its Chief Ministerial candidate) will also restore some of its vote share that it lost during the 2014 general elections, but not sure whether it would help them better their performance compared to December 2013. 

Whatever be the outcome, the focus of this elections has been either to support or oppose Arvind Kejriwal/AAP. With voting getting completed in a few hours from now, all eyes and ears till the 10th  of February will be between AAP and BJP.


05 January 2015

PK, firki, and Vimana Shastra

Yesterday we saw PK. In fact, this is the first movie that the three of us (wife, daughter and me) saw in a theater together. It was a nice family time spent on the last day of school vacations this winter.


The movie is entertaining and thought provoking. To us, it did not at all look controversial. In fact, there must have been many movies prior to this that depicted certain aspects of different religions in a critical manner and in any case there was a disclaimer-cum-apology to begin with. Nevertheless, people opposing the movie by invoking religious sentiments only end up supporting the movies contention. However, the opposition is inevitable, as we are now in the age of 'wrong numbers'.

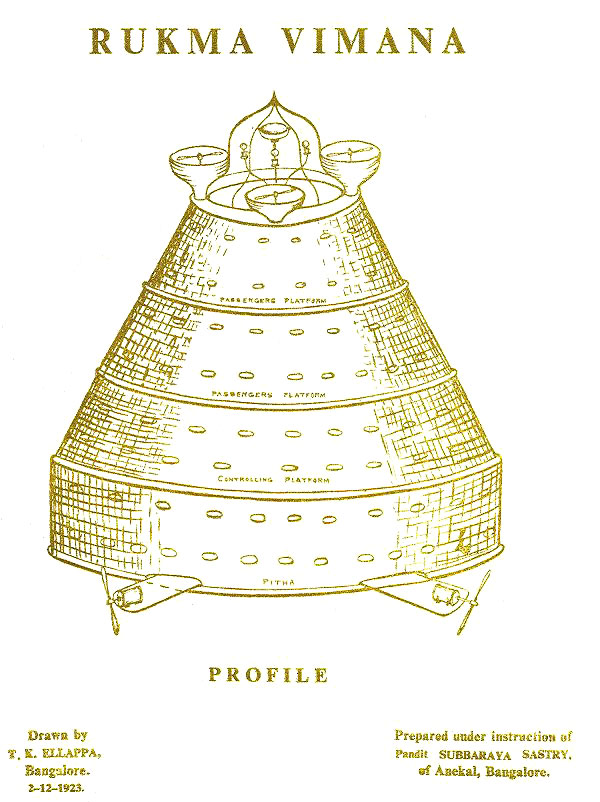
Independent of this concern, I was intrigued by the movie's relationship to an alien from space who looks very much human. For a moment if we consider this science fiction to be real then it opens up further questions. Does this alien have a relationship with humans because earlier alien from their planet came and settled down on Earth? Or, is it because eons ago some humans had access to a knowledge that helped them travel and settle down in another planet? Both these possibilities can give some credence to the discourse on Vimanika Shastra (see the book, an English translation by GR Josyer, and also see a critical evaluation of it by HS Mukunda et al). 

  
The 102nd Indian Science Congress (3-7 January 2015) had a session on 'Ancient Sciences through Sanskrit' where a paper has been read on 'Ancient Indian Aviation Technology'. There has been a petition questioning its inclusion. As against this, if the organizers have space for discussion of science fiction and the paper has been selected through appropriate procedures then that should be allowed. 

In short, the reasons for which PK's screening ought to be defended are also the same for which a science-fiction based presentation on Vimana Shastra in the Indian Science Congress should also be defended.  In the spirit of public reasoning, dissenters also have their right to air their opinions against PK or argue against the views presented in the paper. PK is in agreement on this.

At another level, PK raises a paradox. On the one hand, PK's existence provides credence to Vimana Shastra; on the other hand, PK is also a critical evaluation of 'Godpersons' taking firki at the expense of commoners.

Between you and me. One could reason out to either agree or disagree with both the possibilities. One can also, in a state of PK perhaps, decide to agree with one and disagree with another. I leave it to one's firki sense on what to agree with.

07 December 2014

Growth, Inequality and Population Effects on Poverty Reduction

This blog, meant for a general readership, is about my new paper Decomposing Poverty Change: Deciphering Change in Total Population and Beyond. This is published in The Review of Income and Wealth that is available under Early View and is also open access. A slide share explaining the method is also uploaded as Decomposing Poverty Change: Within- and Between-group Effects at my bepress page.

It is believed that growth in the economy would address poverty reduction through the trickle-down effect. At the same time, equitable distribution or lowering inequality will also help reduce poverty while also leading us towards a welfare state.


A question that assumes importance is that if in a society the incidence of poverty has reduced (say, from 50 per cent to 40 per cent) then then how much of this is on account of growth in the economy and how much is on account of reductions in inequality. 

Conventionally, poverty reduction has tried to compute these two effects by holding the other constant. What is the growth effect, if inequality is held constant; and what is the inequality effect, if there is no growth.


While dealing with the changes in the proportion of poor, the population remains hidden. However, if the population consists of different subgroups (say, rural and urban) and the overall incidence of poverty is an weighted average then the changes in population shares between the subgroups could also have implications in our understanding of poverty reduction. 

The literature refers to this change in population share as between-group effect (say, migration of people from rural to urban regions has helped reduced poverty in the rural regions, but it has increased it in urban regions while at an aggregate level it has helped reduce poverty). As against this, the growth and inequality effects are referred to as within-group effects.


Further, with the population being hidden, the conventional computations for delineating the effect of growth on poverty reduction have implicitly assumed that there is no change in total population. This is contrary to ground reality as also public policy concerns where increasing population has been an important aspect in designing appropriate poverty reduction strategies. 

Keeping the change in total population in mind, I propose an alternative measure where growth, inequality and population can be considered as within-group effects and this would be independent of the between-group effect on account of changes in population shares across subgroups.

Using the method to Indian data for 2004-05 and 2009-10, one observes the following:
  • At the aggregate all India level, poverty reduced from 37.14 per cent to 29.77 per cent (-7.37 percentage points).
  • Growth effect led to a reduction in poverty by 187 per cent (-13.77 percentage points); from this, 69 per cent is from rural (-9.45 percentage points) and 31 per cent is from urban (-4.32 percentage points).
  • Inequality effect led to an increase in poverty by 2 per cent (0.13 percentage points); from this there was a reduction in poverty by 308 per cent in rural India (-0.40 percentage points) and an an increase in poverty by 408 per cent in urban India (0.53 percentage points).
  • Population effect (total change) led to an increase in poverty by 88 per cent (6.51 percentage points); from this, 63 per cent is from rural India (4.13 percentage points) and 37 per cent is from urban India (2.39 percentage points). The percentage point increase in rural and urban in this as also in some other instances may not add up to the aggregate level due to rounding off.
  • Total within-group effects (growth + inequality + total population change) led to a reduction in poverty by 97 per cent (-7.13 percentage points); from this, 80 per cent is from rural India (-5.72 percentage points) and 20 per cent is from urban India (-1.41 percentage points).
  • Between-group effect (change in population shares between rural and urban regions) led to a reduction of poverty by 3 per cent (-0.25 percentage points), from this there was a reduction of poverty in rural India by 263 per cent (-0.63 percentage points) and an increase in poverty in urban India by 163 per cent (0.39 percentage points). By definition, this will have a negative impact on one region and a positive impact on the other region. The results imply that at an aggregate level rural to urban migration is likely to have contributed to reductions in poverty.
  • From the aggregate all India level reduction (-7.37 percentage points), the contribution of rural India was 86 per cent (-6.35 percentage points) and that of urban India was 14 per cent (-1.02 percentage points).

Getting back to the method, we mention that the computation of the three within-group effects will depend on the choice of the base period and the sequence of computations. Further, the three within group effects as also the between group effects, as shown in our results for India, can all be mutually exclusive. These are discussed in the paper


The link to my open access paper Decomposing Poverty Change: Deciphering Change in Total Population and Beyond published in The Review of Income and Wealth. Also see the slide share explaining the method Decomposing Poverty Change: Within- and Between-group Effects that can be downloaded from my bepress page.

Some other recent blogs of mine on Poverty are:


16 November 2014

Group Differential Measure

This blog is meant for a lay explanation of the paper Group Differential for Attainment and Failure Indicators (see Enhanced HTMLview) in the Journal of International Development. It develops on the premise that if a society is progressing then it ought to reduce gaps across groups. In other words, as society progresses, it ought to be become increasingly inequity conscious.


For instance, if there exists a society, with equal proportion of female and male population, where literacy rate for females is 40 per cent and that for males is 50 per cent. After a decade, there is not much change in the population composition, but due to public policy interventions and the literacy rate for females increases to 50 per cent and that for males increases to 60 per cent. This increased attainment in literacy rates is commendable, but it is equally worrisome that the gap in literacy rates between the two groups remains the same at 10 percentage points. Thus, we would state that such an increase an attainment of literacy rate has fails a simple difference based level sensitivity. It is in this sense that this higher level of attainment is not commensurate with the society being increasingly inequity conscious.

A group differential measure that takes the simple difference of the measures for the two groups would fail this level sensitivity test.  

To address this, one could suggest, squaring of the literacy rates and then taking the difference and then after manipulation (for a comparable value that lies between 0 and 100) gives us a group differential measure that is {(50^2)-(40^2)}/100=9 percentage points in the first scenario and 11 percentage points in the second scenario. This satisfies level sensitivity, as it gives a lower value at the lower level of attainment. However, it fails to be policy sensitive at the lower level of attainment. In other words, when the actual gap between the literacy rates is 10 percentage points, our measure shows a 9 percentage point difference. Thus, it is possible that while this measure is not a representation of the actual percentage point difference, but it could lead to complacency at lower levels of attainment.

One possible way out is to take a ratio of the simple difference to the simple difference between maximum attainment and half of the attainment for female literacy rate and then manipulate to obtain a comparable value, that is {(50-40)/(100-20)}*100=12.5 percentage points in the first scenario and 13.3 percentage points for the second scenario.

Thus, we come up with a group differential measure that imposes greater inequity consciousness at higher levels of attainment and also is sensitive to policy implications. The discussion in the paper also shows that this approach also satisfies normalisation and montonocity properties. It also proposes an alternative measure that satisfy similar properties for failure indicators. The paper has examples using an attainment and a failure indicator that are relevant for the Millennium Development Goals (MDGs).

Other related papers


Working Paper version of the Current Paper


27 September 2014

New Poverty Estimate: Some Concerns

Introduction
This blog post should be read as a complement to my recent note on Reading Between the Poverty Lines in the Economic and Political Weekly (27 September 2014). The note has been written in response to the Report of the Expert Group to Review the Methodology for Measurement of Poverty (Chair: C Rangarajan, hereafter Rangarajan report/method) that was submitted to the government on 30 June 2014 and is now available in the public domain. In this blog, I will raise some concerns based on my immediate reactions on this new method, but before that a quick background.

Source: Cartoonscape, The Hindu, 8 July 2014

Background
A Working Group suggestion of 1962 based on a balanced diet requirement by the Indian Council of Medical Research (ICMR) in 1958 arrived at monthly per cpaita poverty lines of Rs.20 for rural areas and Rs.25 for urban areas in 1960-61 prices.

In January 1979, the Report of the Task Force on Projection of Minimum Needs and Effective Consumption Demands (Chair: YK Alagh, hereafter Alagh report/method) used age-sex-activity specific calorie allowances recommended by the Nutrition Expert Group of 1968 to arrive at a per capita per day average calorie requirement of 2435 kcal for rural areas and 2095 kcal for urban areas (for convenience rounded off to 2400 kcal for rural areas and 2100 kcal for urban areas and referred to as the calorie norms for rural and urban areas respectively). Based on consumption expenditure around these average requirements, they arrived at monthly per capita poverty lines of Rs.49.09 for rural areas and Rs.56.64 for urban areas in 1973-74 prices. While anchored in 'calorie norms', these poverty lines are behaviourally determined and indicate the purchasing power needed to meet these norms with some margin for consumption of non-food items. This gives a consumption basket around the poverty line.

The July 1993 Report of The Expert Group on Estimation of Proportion and Number of Poor (Chair: Late DT Lakdawala, hereafter Lakdawala report/method) used the Alagh report's average calorie requirements and the commodity basket associated with the poverty lines for the base year, 1973-74. However, to address variations in prices and consumption patterns across states (and also over time) they used appropriate state-specific consumer price indices (separate for rural and urban areas) and applied the Fisher's index to arrive at state-specific poverty lines.  These poverty lines, as indicated earlier, indicated the purchasing power needed to meet the calorie norm, but the actual consumption could be different that gives us  a commodity basket pegged around the poverty lines for the base year.   

Over time, the updated poverty lines (say, for 2004-05) pegged to the 1973-74 base years differed substantially from the average calorie requirement/calorie norm (see Utsa Patnaik's A Critical Look at some Propositions on Consumption and Poverty). This and other considerations led to the setting up of an  Expert Group with SD Tendulkar as its chairperson. Their report (hereafter Tendulkar report/method) submitted in November 2009 had to do away with the dated average calorie requirement, but they did not have any alternative reference to begin with. Hence, for pragmatic considerations, they begin by using the proportion of poor for urban India, 25.7 per cent for 2004-05, computed by the Lakdawala method, as a base. The difference being that they shift away from the use of monthly uniform recall period (URP) data to the mixed recall period data that combines annual recall for five low frequency items (clothing, footwear, consumer durable, education, and institutional health expenditure) with monthly recall for the remaining items. 


Given the proportion of poor for urban India, the Tendulkar report computed a commodity basket for the third decile group (20-30 per cent). Now, the consumption amount for this decile group became the new base associated with the poverty line basket, which was used to arrive at all-India rural and also rural and urban state-specific poverty line baskets from an appropriate state-specific decile group. 

Another departure for the Tedulkar report was to discard the consumer price indices and instead use prices determined endogenously from the household level consumption expenditure data by taking the average per capita expenditure of a commodity per unit consumed. Like the Lakdawal report, the Tendulkar report also used the Fisher price index to obtain state-specific poverty lines and also for future updating of these poverty lines. Instead of separate poverty line baskets for rural and urban areas, as was the case for both Alagh and Lakdawala methods, the Tendulkar method had only the urban poverty line basket for 2004-05 as base. 

A number of questions have been raised on the Tendulkar method, see Poverty Estimates in India: Old and New Methods, 2004-05 for a critical discussion. This necessitated the search for a new method.

The Rangarajan Method
Meanwhile, the ICMR came up with the Nutrient Requirements and Recommended Dietary Allowances for Indians in 2010. Based on this and taking a cue from the Alagh method, the Rangarajan method superimposes the age-sex-activity specific composition and updates the average per capita per day dietary requirements for calorie (2155 kcal in rural and 2090 kcal in urban), protein (48 grams in rural and 50 grams in urban) and fat (28 grams in rural and 26 grams in urban). From a purchasing power perspective, all these are possible at a monthly per capita food expenditure of Rs.554 (sixth fractile group, 25-30 per cent) for rural India and Rs.656 (fourth fractile group, 15-20 per cent) for urban India.   

In addition, expenditure in the median fractile class (45-50 per cent) is considered as the norm for four essential non-food  items, viz., education, clothing, shelter (rent) and mobility (conveyance). This turns out to Rs.141 for rural and Rs.407 for urban areas.

For all other non-food items, the expenditure for the fractile group identified with the poverty line basket is behaviourally determined. This turns out to Rs.277 for rural and Rs.344 for urban areas. 

Adding up the above three gives monthly per capita poverty lines of Rs.972 for rural and Rs.1407 for urban areas. These give the associated poverty line baskets.

Like the Lakdawala method, the Rangarajan method uses Fisher price index on the all-India poverty line basket to state-specific poverty line baskets to obtain the state-specific poverty lines for rural and urban areas. The Rangarajan method continues with the Tendulkar method's use of prices from the household level consumption expenditure data. The state-specif poverty lines help compute the rural and urban state-specific poverty ratios and their weighted average gives the all-India poverty ratios.

A departure in the Rangarajan method is that its computations are based on the modified mixed recall period (MMRP) consumption expenditure data, which, from 2009-10, also collected weekly consumption expenditure data for some high frequency food items (edible oil, egg, fish and meat, vegetables, fruits, spices, beverages, refreshments, processed food, pan, tobacco and intoxicants). Under MMRP, like MRP, the five low frequency items continue to be based on annual recall. For all other items that are not identified as low or high frequency items, the monthly recall continues.

In short, the new method is an updating of the 'calorie norm' that is age-sex-activity standardised (Alagh method) to obtain poverty line baskets at the all-India level for rural and urban areas and then it applies the Fisher's index to obtain state-specific poverty lines (Lakdawala method) by using prices from the household level consumption expenditure data (Tendulkar method). In addition, the Rangarajan method uses MMRP and also adds a normative criterion for four non-essential food items.Thus, it is an improvement over the earlier methods. Nevertheless, it raises some concerns, which I elaborate below.

Some Concerns
The combining of expenditure from two fractile groups is statistically plausible, but it poses a behavioral dilemma. This is so because the aggregate all-India poverty line is derived from two different fractile groups - one for food and most non-food items and the other for four essential non-food items. An alternative could have been dual poverty lines, as suggested in my note, Reading Between the Poverty Lines (Economic and Political Weekly, 27 September 2014).

The aggregate all-India rural and urban poverty lines are not meant for computing poverty ratios. If computed then then this poverty ratio will not be sub-group consistent.  In other words, the poverty ratio computed through this method will not be equal to the poverty ratio that is a weighted average of the state-specific poverty ratios.

In particular, the quantities used at the all-India poverty line basket will not be weighted averages of the quantities associated with the state-specific poverty line baskets. Once we question the all-India poverty lines then its usage in the Fisher price index to derive the state-specific poverty lines also come into question.

If one uses the 2010 calorie allowances suggested by ICMR for each state separately then by superimposing the state-specific age-sex-activity composition one will arrive at state-specific average requirements. There is an argument that different average requirements call for different poverty benchmarks. However, continuing with the Lakdawala method, the Rangarajan method uses only the the all-India average requirement to ensure comparability.

In addition to calorie deprivation, the allowances of ICMR 2010 can also be used to compute protein and fat deficiencies. Comparing and contrasting these three deprivations might be insightful.

As already mentioned, the poverty lines indicate the purchasing power needed to meet the average requirements. In short, all the state-specific poverty lines (separately for rural and urban areas) would be identified with the same purchasing power. This, along with the fact that the all-India poverty lines are not sub-group consistent, calls for caution in comparing the all-India poverty lines with purchasing power parity (PPP) in dollar terms.

The Rangarajan method points out that the proportion of poor at the combined all-India level declined from 38.2 per cent in 2009-10 to 29.5 per cent in 2011-12; that is, 8.7 percentage point decline in poor. While this is commendable, one should not read too much into this decline, as 2009-10 was a drought year.

It is possible that some non-poor population just above the poverty line would have become poor if they would not have been the recipient of some welfare schemes. If possible, quantifying these would show the impact of such interventions.

While, the current poverty lines are an improvement over the earlier methods, the inclusion of four non-essential items is not based on an absolute norm and they do still miss out on some other essential items like health and sanitation among others.

Finally, even if one keeps aside the above points, the Rangarajan method points out that in 2011-12, the proportion of poor are 30.9 per cent in rural and 26.4 per cent in urban areas. This is still a substantial amount and a matter of serious concern from a public policy perspective.

Concluding Remarks
Notwithstanding the improvements in the Rangarajan method, there are important methodological and public policy concerns. One possible alternative that the Rangarajan report could have followed or at least given as an alternative was to calculate region- (rural and urban) and state-specific average calorie requirement. They being not comparable can be a matter of methodological debate, but its need was already pointed out by S Guhan in the Lakdawala report. And, in any case, this approach of having separate calorie norms is already being followed for rural and urban India and it has not come in the way of comparison at the combined level. In future, a move towards measuring multiple dimensions of poverty would also be helpful.

An elaborate version of this blog post has been published as Reading Between the Poverty Lines in the Economic and Political Weekly (27 September 2014).